Documentation
Everything you need to know about Analytix402 — from first install to running a fleet of AI agents. If something's unclear, that's on us. Hit us up at team@analytix402.com.
What is Analytix402?
Analytix402 is a monitoring and analytics platform for APIs that use x402 payments. Think of it as Datadog meets Stripe Dashboard, but purpose-built for the x402 ecosystem.
If you're building an API that charges per request using the HTTP 402 protocol, you're probably flying blind right now. You don't know how many requests you're getting, which wallets are paying you, how much revenue you've made today, or whether your endpoints are even healthy. Analytix402 fixes all of that.
And if you're on the other side — running AI agents that consume paid APIs — we help you track what your agents are spending, catch duplicate purchases, and set budget guardrails so a rogue agent doesn't drain your wallet overnight.
We serve two kinds of users:
- Builders — developers who run x402-enabled APIs and want visibility into requests, revenue, customers, and security.
- Operators — people running AI agents that call paid APIs, who need spend tracking, budget controls, and fleet management.
How it works
The core idea is simple. You drop a small piece of code into your app (or your agent), and it starts sending event data to Analytix402 in the background. We process that data and give you a real-time dashboard with everything you need.
Here's the flow:
- You install the SDK — one npm package, one line of middleware. Takes about two minutes.
- Your API handles requests as usual — the SDK quietly captures request metadata, response codes, timing, and any x402 payment headers.
- Events get batched and sent — we batch events in the background and flush them every few seconds. Your API doesn't slow down at all.
- Your dashboard lights up — revenue charts, request volumes, customer breakdowns, security scores. All real-time.
The SDK adds less than 50ms of overhead per request, and it never blocks your response. If our servers are unreachable, events queue locally (up to 1,000) and get sent when the connection comes back.
Quickstart
Let's get you from zero to "seeing data in the dashboard" as fast as possible.
Step 1: Sign up at analytix402.com and grab your API key from the settings page. It'll look like ax_live_xxxxx.
Step 2: Install the SDK in your project:
added 1 package in 2.3s
+ @analytix402/sdk@0.1.1
1 package is looking for funding
run `npm fund` for details
Step 3: Add the middleware to your Express app, before your routes:
import express from 'express';
import { Analytix402 } from '@analytix402/sdk';

const app = express();

app.use(Analytix402({
  apiKey: 'ax_live_your_key_here',
}));

// your routes go here
app.get('/api/data', (req, res) => {
  res.json({ data: 'hello world' });
});

app.listen(3000);
Step 4: Make a request to your API and check the dashboard. You should see your first event within a few seconds.
That's it. Three lines of code and you're done.
SDK Installation
The SDK is published on npm as @analytix402/sdk. You need Node.js 18 or higher.
added 1 package in 2.3s
+ @analytix402/sdk@0.1.1
If you're using yarn or pnpm, those work fine too:
# or
$ pnpm add @analytix402/sdk
The package ships with TypeScript types included, so you get autocompletion out of the box. It supports both CommonJS (require) and ESM (import).
Express middleware
The most common way to use the SDK is as Express middleware. You add it once, and it automatically tracks every request that comes through your API.
import { Analytix402 } from '@analytix402/sdk';

// Add this BEFORE your routes
app.use(Analytix402({
  apiKey: 'ax_live_your_key_here',
}));
Order matters here. The middleware needs to be registered before your route handlers, otherwise it won't see the requests. If you're using other middleware like cors() or express.json(), Analytix402 can go right after those.
What gets captured automatically:
- Request data — method, path, query params, status code, response time
- Payment data — amount, currency, payer wallet, transaction hash (pulled from x402 headers)
- Metadata — IP address, user agent, timestamp, geo location
The middleware works with Express 4.x and 5.x. We're adding support for Hono and Fastify soon.
Configuration
The only required option is apiKey. Everything else has sensible defaults, but here's the full list if you want to tweak things:
| Option | Default | What it does |
|---|---|---|
apiKey | — | Your API key. Required. |
baseUrl | https://api.analytix402.com | Where events get sent. Change this if you're self-hosting. |
debug | false | Logs SDK activity to the console. Useful when first setting up. |
batchSize | 100 | How many events to collect before sending a batch. |
flushInterval | 5000 | Max time (ms) between flushes, even if the batch isn't full. |
maxRetries | 3 | How many times to retry a failed send before dropping the batch. |
maxQueueSize | 1000 | Max events to hold in memory if the network is down. |
timeout | 10000 | Request timeout (ms) for sending events. |
excludePaths | [] | Paths to skip. Supports wildcards like /internal/*. |
getEndpointName | — | Custom function to name endpoints (e.g., group /users/123 as /users/:id). |
shouldTrack | — | Function that returns true/false to decide whether a request gets tracked. |
Some paths are excluded by default so you don't clutter your dashboard with health checks: /health, /healthz, /ready, /readyz, /live, /livez, /metrics, /favicon.ico, and /.well-known.
Manual tracking
Not using Express? No problem. You can track events manually with the client:
import { createAnalytix402Client } from '@analytix402/sdk';

const client = createAnalytix402Client({
  apiKey: 'ax_live_xxxxx',
});

// Track a request
client.track({
  type: 'request',
  method: 'GET',
  path: '/api/data',
  statusCode: 200,
  responseTimeMs: 45,
  timestamp: new Date().toISOString(),
  payment: {
    amount: '0.01',
    currency: 'USDC',
    wallet: '0x8f2a...',
    status: 'success',
  },
});

// Always flush before shutting down
await client.flush();
await client.shutdown();
The manual client uses the same batching and retry logic as the middleware. It just gives you full control over what gets tracked and when.
Agent tracking
If you're building AI agents (trading bots, data scrapers, autonomous workflows, that sort of thing), the SDK has dedicated methods for tracking agent health and activity.
const client = createAnalytix402Client({
  apiKey: 'ax_live_xxxxx',
  agentId: 'my-trading-agent',
  agentName: 'Trading Bot',
});

// Heartbeats — so you know the agent is alive
setInterval(() => {
  client.heartbeat('healthy', { uptime: process.uptime() });
}, 30000);

// Task tracking — measures duration automatically
const task = client.startTask('rebalance-portfolio-42');
try {
  await doRebalance();
  task.end(true, { positions: 12 });
} catch (err) {
  task.end(false, { error: err.message });
}

// LLM usage — track tokens and cost
client.trackLLM({
  model: 'claude-sonnet-4-5-20250929',
  provider: 'anthropic',
  inputTokens: 1500,
  outputTokens: 300,
  costUsd: 0.012,
  durationMs: 820,
});
All of this shows up in the Operator dashboard, where you can see agent status, task success rates, and LLM spend broken down by model and provider.
AI SDK wrappers
If your agent calls OpenAI, Anthropic, or any HTTP API, we have thin wrappers that automatically track usage without you having to instrument every call:
// Wrap the OpenAI client
import { wrapOpenAI } from '@analytix402/sdk/openai';

// Wrap the Anthropic client
import { wrapAnthropic } from '@analytix402/sdk/anthropic';

// Wrap fetch for any HTTP API
import { wrapFetch } from '@analytix402/sdk/fetch';
These wrappers intercept outbound calls, measure timing and token usage, and report everything back to your dashboard. You use the underlying SDKs exactly as you normally would — the wrappers are transparent.
Proxy URL
Don't want to install anything? You can route your API calls through our proxy instead. We handle payment, tracking, and circuit breaker enforcement for you.
Instead of calling the API directly:
// Instead of this:
fetch('https://weather-api.example.com/forecast?city=NYC')

// Do this:
fetch('https://analytix402.com/api/p/weather-api/forecast?city=NYC', {
  headers: {
    'X-Spend-Key': 'sk_live_your_spend_key',
  },
})
The proxy takes care of x402 payment negotiation, records the transaction, and forwards the response back to you. It's the fastest way to get analytics without touching your code at all.
MCP Server — Overview
The MCP server lets you manage your Analytix402 account directly from Claude Desktop (or any other MCP-compatible client). Instead of switching to a browser to check on your agents, you can just ask Claude.
Things you can do from Claude:
- See a fleet overview — how many agents are running, total spend, health status
- Pause, resume, kill, or revive individual agents
- Pull P&L reports for the last 7, 30, or 90 days
- Check LLM token usage and cost breakdowns
- Create or delete circuit breakers
- View recent activity and efficiency scores
- Find duplicate API purchases your agents are making
It's especially handy when you're already in Claude working on something and don't want to context-switch.
MCP — Setup for Claude Desktop
Step 1: Install the server globally:
added 12 packages in 4.1s
+ @analytix402/mcp-server@0.1.0
installed 1 binary: analytix402-mcp
Step 2: Open your Claude Desktop config file. The location depends on your OS:
| OS | Config file path |
|---|---|
| macOS | ~/Library/Application Support/Claude/claude_desktop_config.json |
| Windows | %APPDATA%\Claude\claude_desktop_config.json |
| Linux | ~/.config/Claude/claude_desktop_config.json |
Step 3: Add the Analytix402 server to your config:
{
  "mcpServers": {
    "analytix402": {
      "command": "analytix402-mcp",
      "env": {
        "ANALYTIX402_API_KEY": "ax_live_your_key_here"
      }
    }
  }
}
If you'd rather not install globally, you can use npx instead:
{
  "mcpServers": {
    "analytix402": {
      "command": "npx",
      "args": ["@analytix402/mcp-server"],
      "env": {
        "ANALYTIX402_API_KEY": "ax_live_your_key_here"
      }
    }
  }
}
Step 4: Restart Claude Desktop. The Analytix402 tools should show up in your tool list. Try asking Claude "What's my fleet overview?" to verify it's working.
MCP — Available tools
Once connected, Claude can use any of these tools on your behalf:
| Tool | What it does |
|---|---|
fleet_overview | High-level summary of your agent fleet — total agents, requests, spend, health |
list_agents | All agents with their status, request counts, spend, and error rates |
get_agent | Deep dive on a specific agent by ID |
pause_agent | Pause an active agent |
resume_agent | Resume a paused agent |
kill_agent | Immediately stop an agent (use carefully) |
revive_agent | Bring a killed agent back to active |
fleet_pnl | Profit & Loss report over 7d, 30d, or 90d |
llm_usage | Token usage summary by model and agent |
circuit_breakers | List all circuit breakers and their status |
create_circuit_breaker | Create a new spend, rate, or error limit breaker |
delete_circuit_breaker | Remove a circuit breaker |
recent_activity | Latest agent activity feed |
efficiency_scores | How well agents are using API responses |
duplicate_purchases | Find agents buying the same data repeatedly |
spend_insights | AI-generated recommendations for saving money |
price_comparison | Compare pricing across the APIs your agents use |
OpenClaw Skill — Overview
If you're running agents on OpenClaw, the Analytix402 skill gives your agent built-in spend awareness. It can check its own budget, flag suspicious purchases, and report back on how much it's been spending.
This is particularly useful for autonomous agents that make financial decisions on their own. Without guardrails, an agent calling paid APIs in a loop can burn through real money fast. The skill puts a safety net in place.
OpenClaw — Setup
You'll need Node.js 22 or higher for this one (OpenClaw's runtime requirement).
added 2 packages in 1.8s
+ @analytix402/openclaw-skill@0.1.0
Then set these environment variables in your agent config:
| Variable | Required | What it does |
|---|---|---|
ANALYTIX402_API_KEY | Yes | Your Analytix402 API key |
ANALYTIX402_AGENT_ID | No | Unique name for this agent (helps identify it in the dashboard) |
ANALYTIX402_BASE_URL | No | Custom API endpoint (default: https://analytix402.com) |
ANALYTIX402_DAILY_BUDGET | No | Daily spend limit in USD (e.g., 50.00) |
ANALYTIX402_PER_CALL_LIMIT | No | Max spend per individual API call in USD |
ANALYTIX402_TRACK_LLM | No | Set to true to automatically track LLM token usage |
OpenClaw — Skill tools
Once the skill is loaded, your agent gets these tools:
| Tool | What it does |
|---|---|
analytix402_spend_report | Full breakdown of what the agent has spent — by API, by LLM provider, with an efficiency score |
analytix402_set_budget | Update the daily budget on the fly |
analytix402_check_budget | Check how much budget is left before making an expensive call |
analytix402_flag_purchase | Flag a purchase as potentially duplicate or wasteful |
The agent can call these tools proactively. For example, a well-designed agent might call check_budget before any API call over $1, and flag_purchase when it notices it's fetching data it already has.
Dashboard — Overview
The dashboard is where everything comes together. Once events start flowing in from your SDK (or from agents via the OpenClaw skill), you'll see real-time data across several views.
The main dashboard shows your top-line numbers: total revenue, today's revenue, active endpoints, and request volume over the last 30 days. Below that you get a recent requests feed that updates in real time via WebSocket.
Navigation is split into sections based on what you need. There's a sidebar on desktop and a bottom nav bar on mobile.
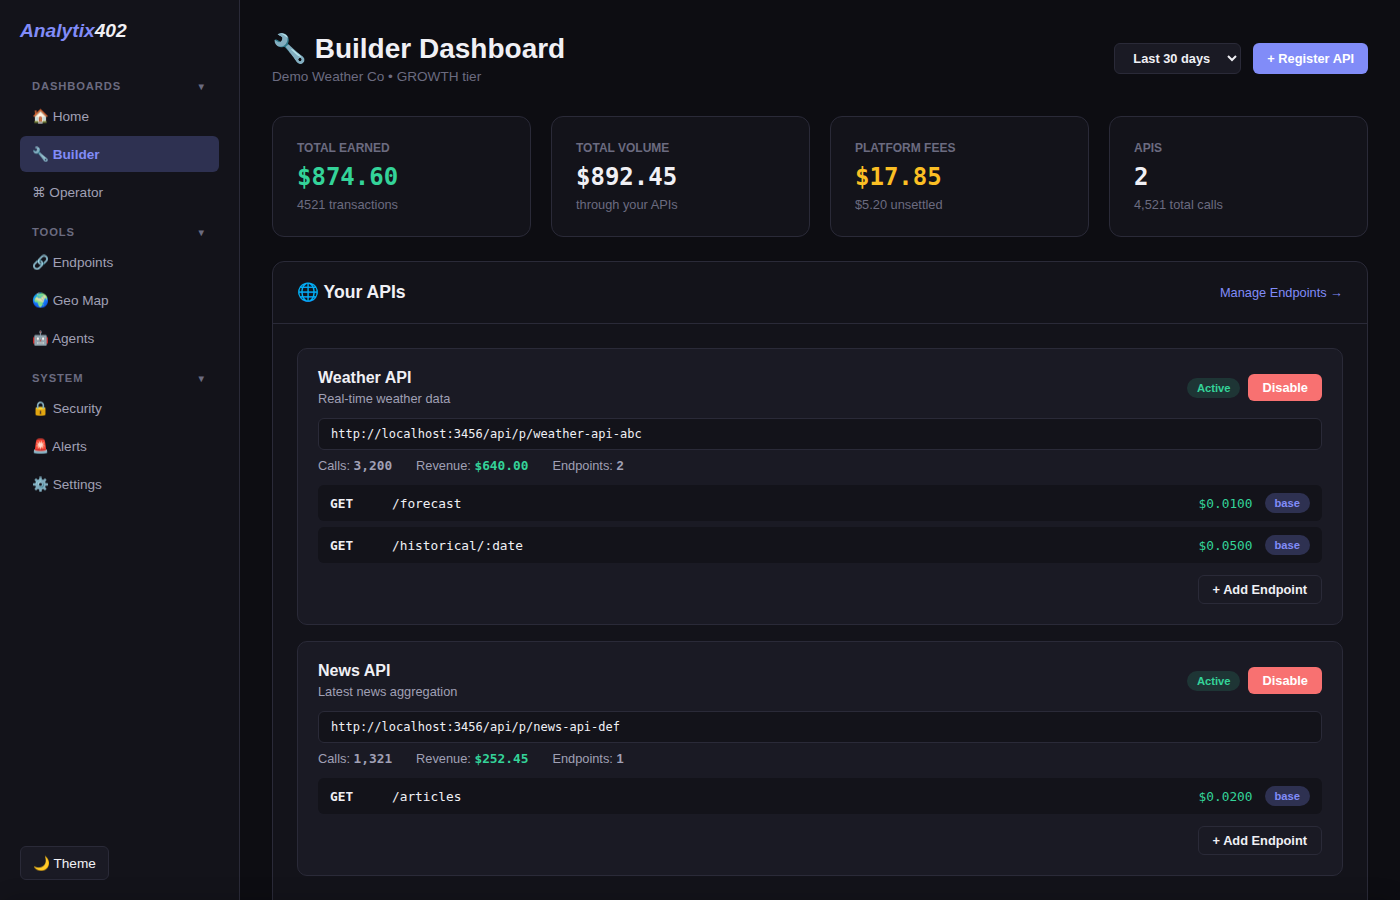
Dashboard — Builder view
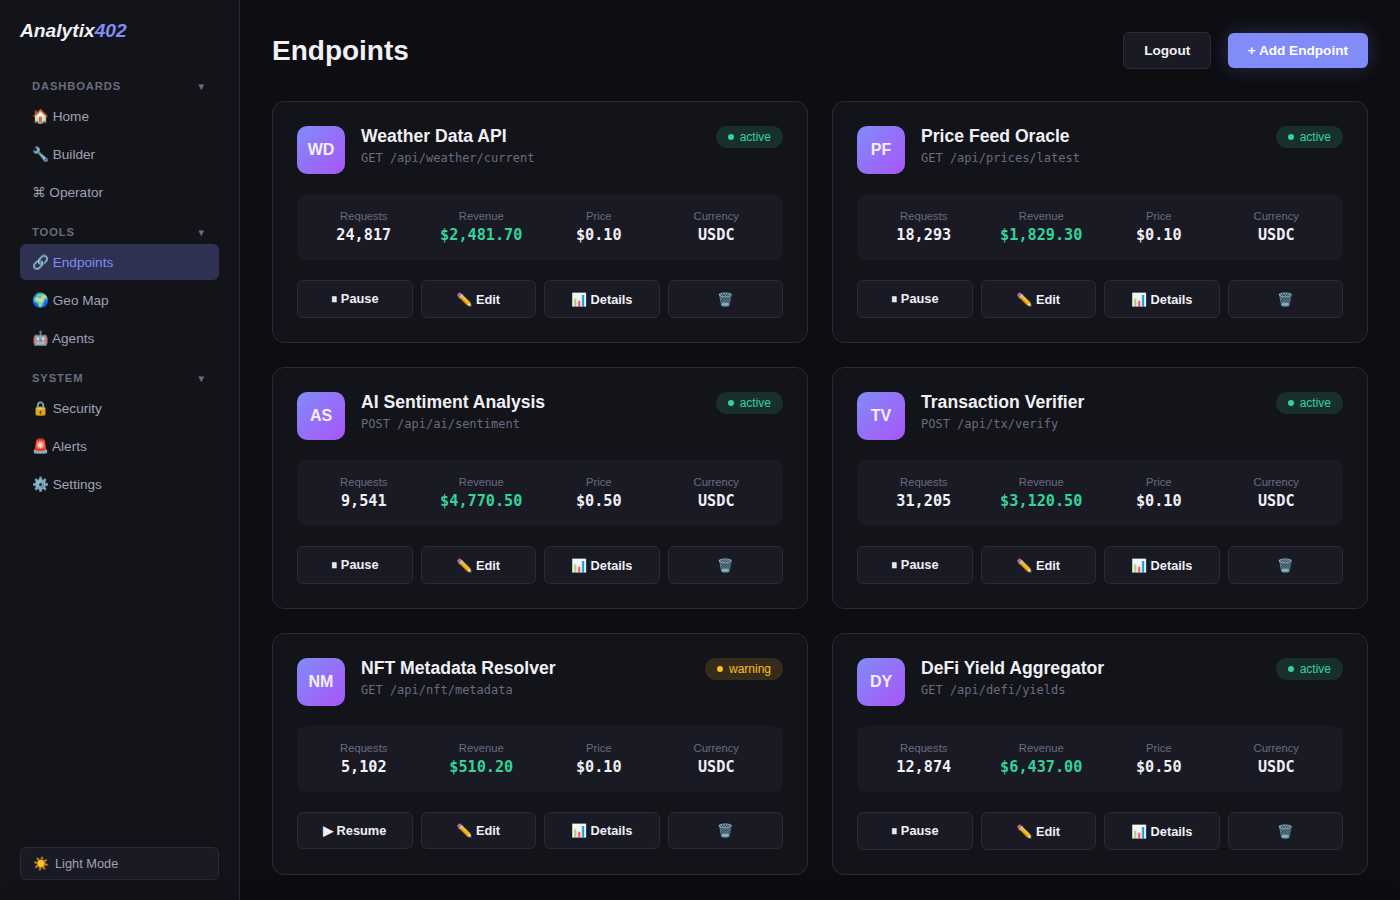
The Builder view is designed for developers running x402 APIs. This is your home base for understanding how your API is performing.
- Endpoints — see each endpoint's request count, revenue, average response time, and error rate. Click into any endpoint for a time-series chart and detailed request log.
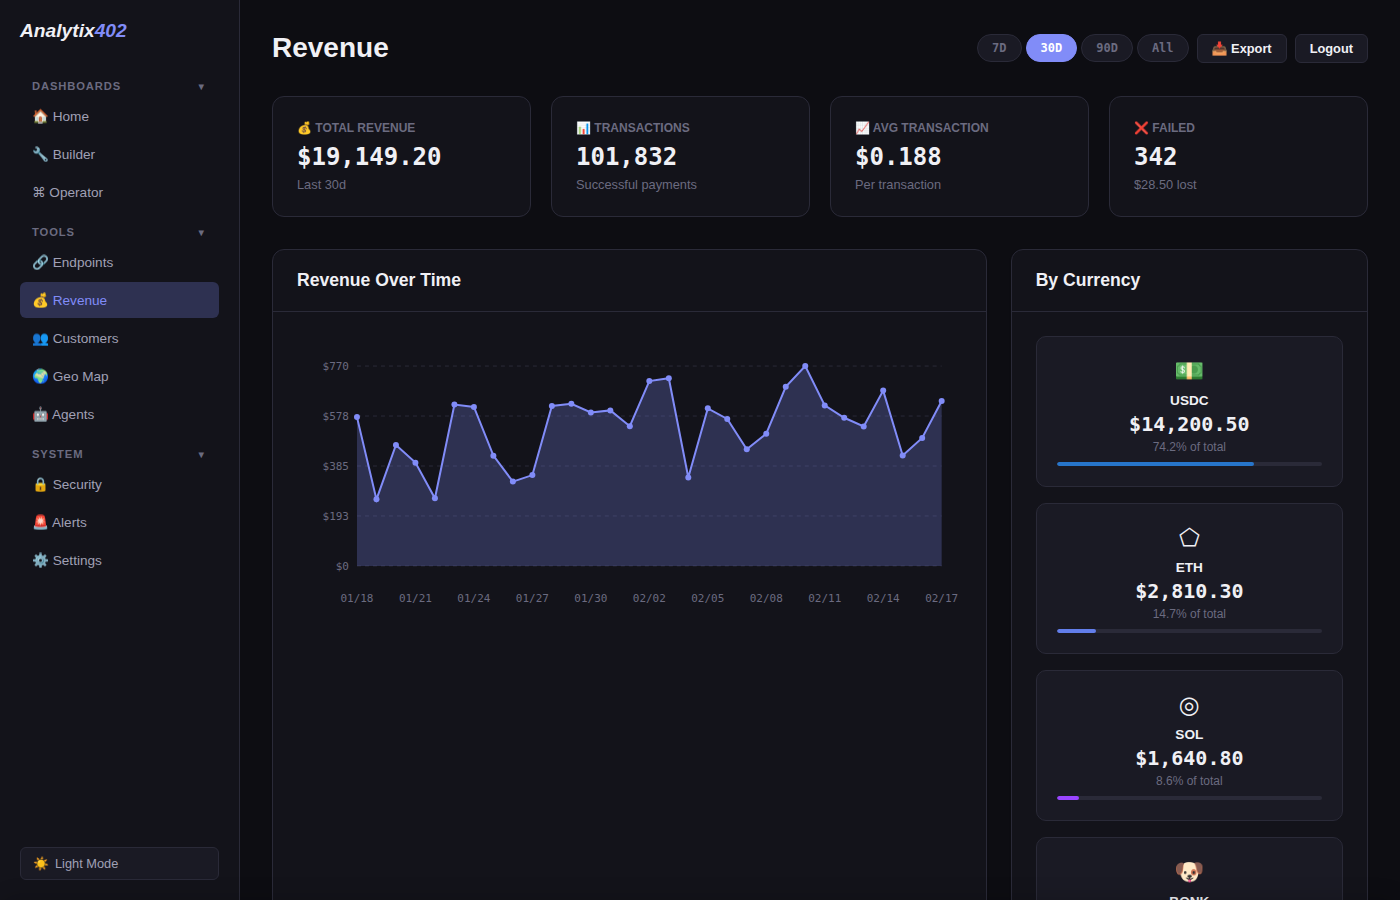
- Revenue — charts showing revenue over time with filtering by endpoint, time range, and chain. Export to CSV or JSON.
- Customers — every wallet that's paid you, sorted by total spend. Click a wallet to see what they've been calling and when.
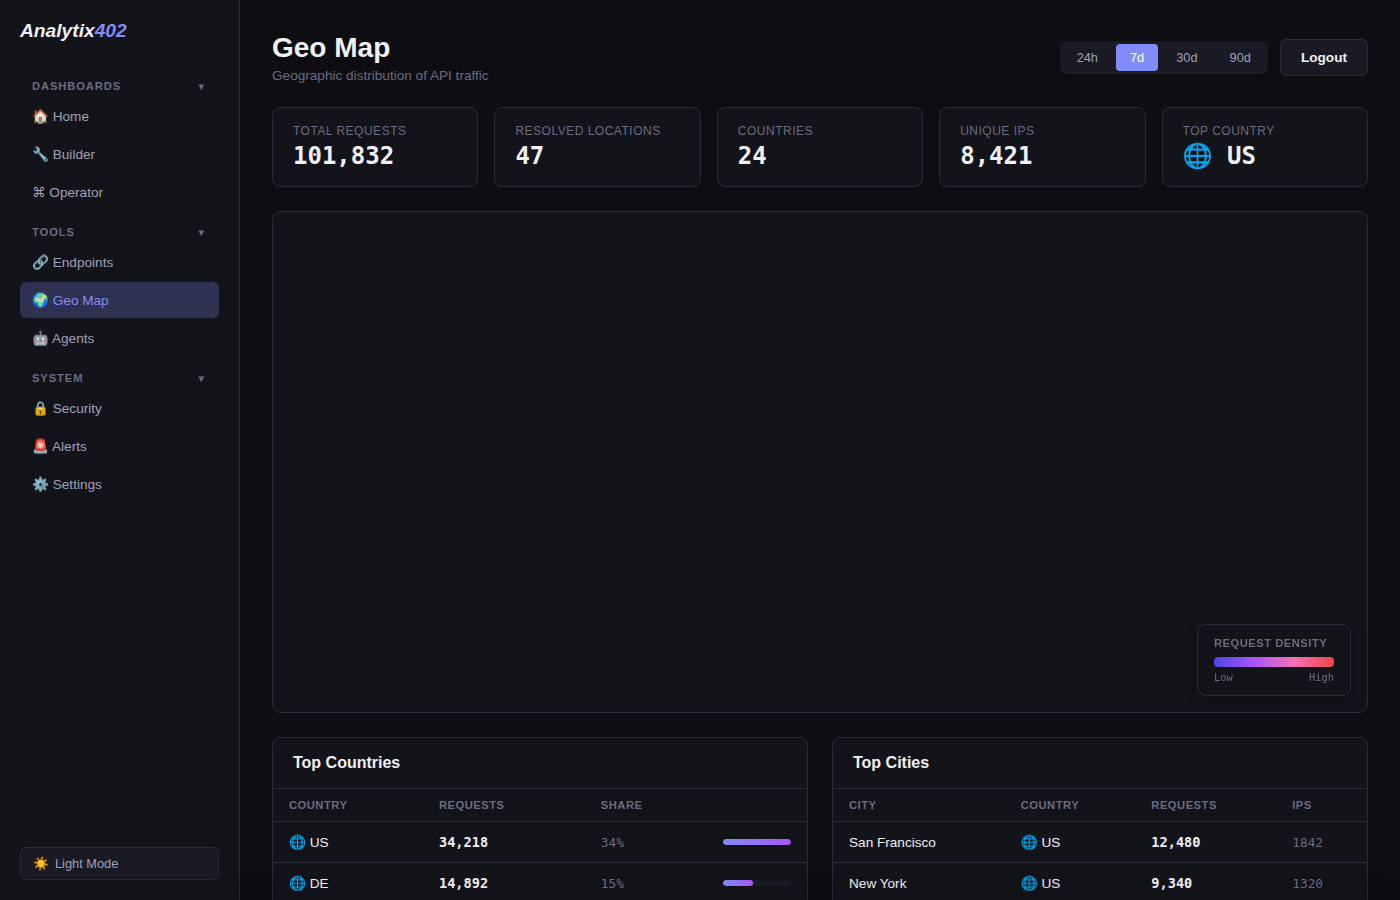
- Geo — geographic breakdown of where your requests are coming from.
Dashboard — Operator view
The Operator view is for people managing AI agents. It's focused on spend, health, and control.
- Agents — live view of all your agents. See which ones are healthy, paused, or dead. Monitor request counts, error rates, and spend per agent.
- Fleet P&L — revenue vs. expenses across your whole fleet. See net profit and margin at a glance.
- LLM Usage — token counts and costs broken down by model and provider. Helps you spot which agents are burning through tokens.
- Circuit Breakers — safety limits you set to automatically pause or throttle agents when spend or error rates get out of hand.
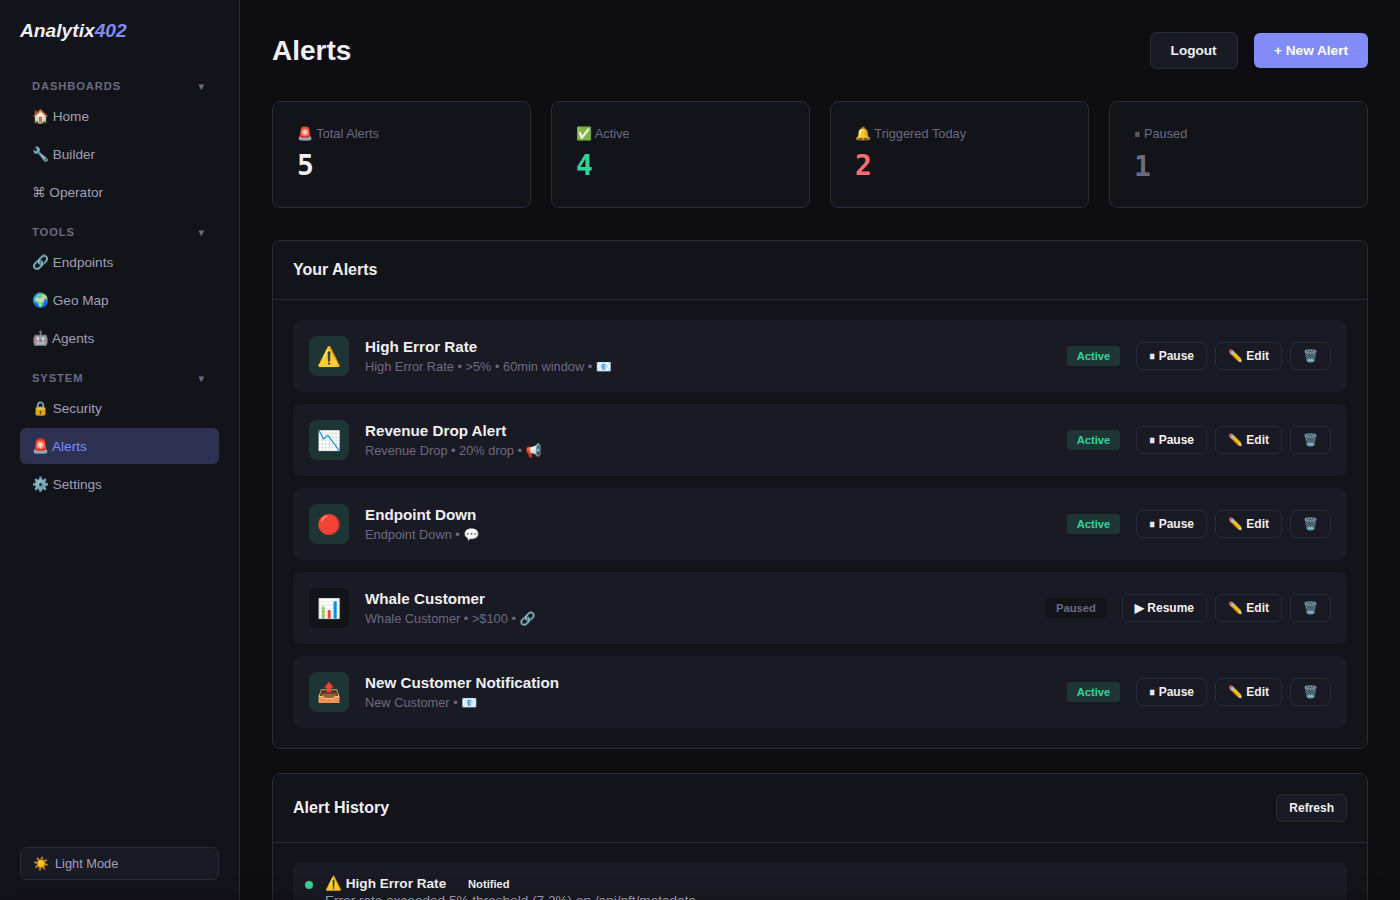
Dashboard — Alerts
You can set up alert rules that fire when something needs your attention. Alerts can be delivered via email, Telegram, Discord, or webhook.
Some things people commonly set alerts for:
- Revenue drops more than 50% in the last hour
- An endpoint goes down (error rate exceeds a threshold)
- An agent exceeds its daily budget
- Response times spike above a certain level
You configure alert rules in the Alerts page. Each rule has a type, threshold, and notification channel. When a rule triggers, we create an alert event and send the notification immediately.
Dashboard — Security scoring
Every endpoint you track gets a security score from 0 to 100. We check for things like SSL/TLS configuration, security headers, CORS setup, rate limiting, and payment security.
The security page gives you an overall score plus per-endpoint breakdowns. Each check tells you what passed, what failed, and what you should fix. It's like a quick audit without hiring a pentester.
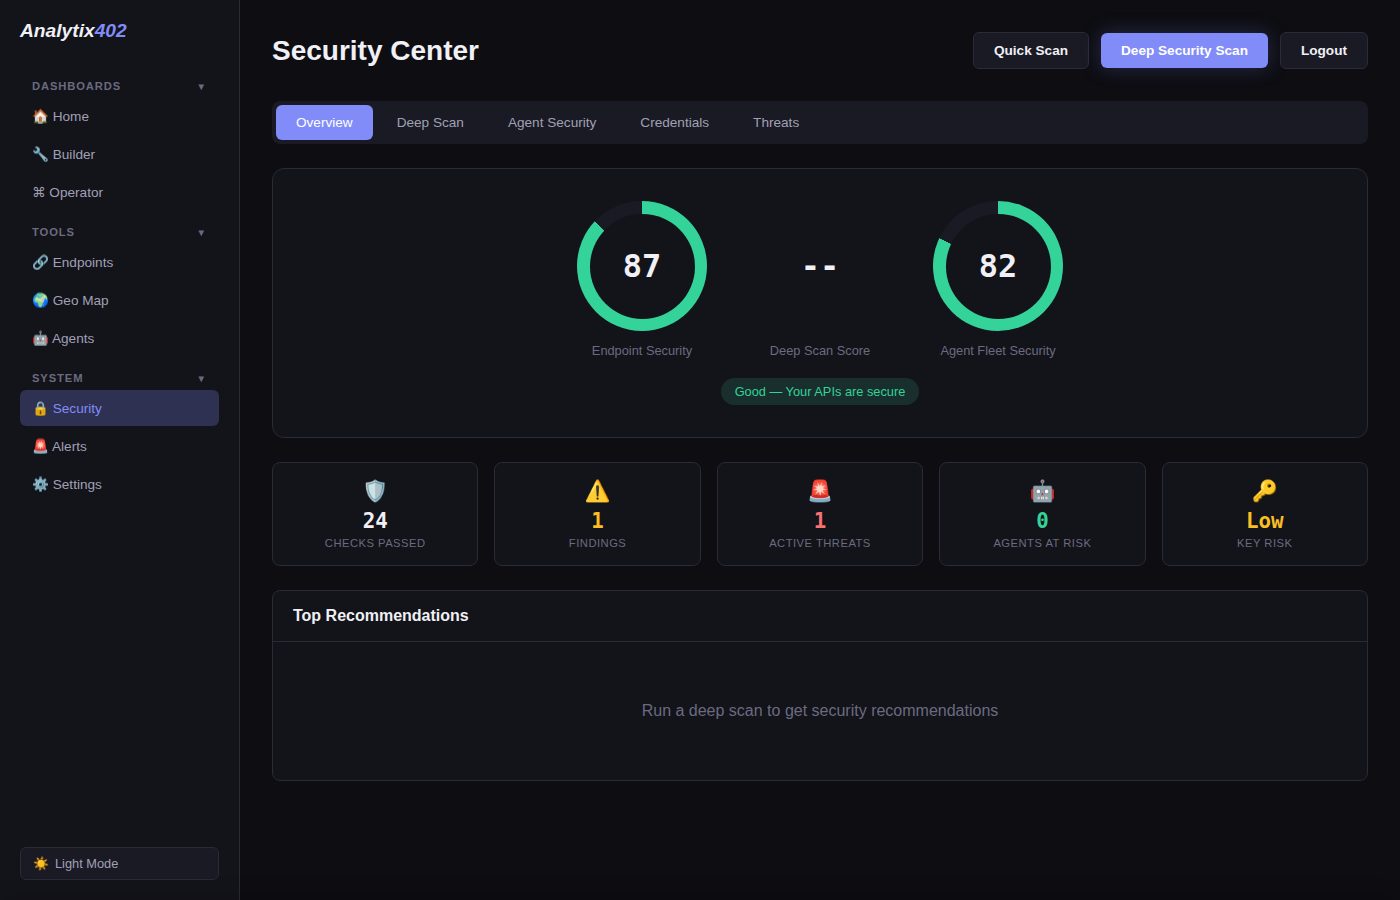
You can also use the public Security API to scan any URL, no signup needed.
The x402 protocol
x402 is a protocol that lets APIs charge for requests using cryptocurrency. It's based on the HTTP 402 status code ("Payment Required"), which has been reserved in the HTTP spec for decades but was never widely used — until now.
Here's how a typical x402 flow works:
- A client makes a request to an API endpoint.
- The API responds with a 402 status, including a payment requirement (how much, which currency, which wallet to pay).
- The client (or a facilitator) makes the payment on-chain.
- The client retries the request with payment proof in the headers.
- The API verifies payment and serves the response.
This all happens in seconds. Facilitators like Coinbase's CDP handle the payment flow automatically, so end users (or agents) don't have to manually send crypto.
Client sends a request to an x402-enabled endpoint
API responds with payment details (amount, currency, wallet)
Facilitator (e.g. CDP) handles the payment automatically
Client retries the request with payment headers attached
API verifies the payment and returns the response
Analytix402 plugs into this flow via the SDK. When a payment-authenticated request completes, the SDK reports the event to your dashboard — giving you analytics on spend, volume, and errors without interfering with the payment itself.
API keys
Your API key is how the SDK authenticates with Analytix402. You get one when you create an account.
Keys come in two flavors:
ax_live_xxxxx— production keys. Events sent with this key show up in your main dashboard and count toward your plan limits.ax_test_xxxxx— test keys. Events are accepted but stored separately. Use these during development so you don't pollute your production data.
Keep your key secret. Don't commit it to version control. Use environment variables or a secrets manager instead.
Circuit breakers
Circuit breakers are automated safety limits for your agents. They monitor a metric in real-time and take action when a threshold is crossed.
There are three types:
- Spend limit — trips when total spend in a time window exceeds a dollar amount. For example: "block if any agent spends more than $100 in 60 minutes."
- Rate limit — trips when request volume exceeds a count. Useful for catching runaway loops.
- Error limit — trips when the error rate exceeds a percentage. Prevents agents from hammering a broken endpoint.
When a breaker trips, it can block (stop all requests), alert (notify you but keep going), or throttle (slow down requests). You configure these in the dashboard or via the MCP server.
Circuit breakers can be global (apply to all agents) or scoped to a specific agent.
Supported chains
Analytix402 works with x402 payments on these blockchains:
- Base — Coinbase's L2. This is where most x402 activity happens today, since Coinbase's CDP facilitator runs on Base.
- Solana — fast and cheap transactions. Growing x402 ecosystem.
We automatically detect which chain a payment was made on by reading the payment headers and transaction data. You don't need to configure anything chain-specific.
How fees work
Analytix402 offers two ways to pay, depending on how you use the platform:
- Pay-as-you-go (fee-based) — $0/mo. Instead, a small percentage is taken from each transaction that flows through the platform. No upfront cost; you only pay when money moves.
- Monthly subscription — a flat monthly price with zero per-transaction fees. Better for high-volume APIs where predictable costs matter.
Per-transaction fees explained
On fee-based plans, the platform deducts a percentage from each payment before the builder receives their payout. The fee percentage depends on your tier — higher tiers cost more but unlock more features.
Fees are expressed in basis points (bps), a standard financial unit where 100 bps = 1%. Here's what a transaction looks like:
Transaction: $10.00 USDC API call
Builder tier: Pro (2% fee = 200 bps)

  Platform fee:     $10.00 × 2%  = $0.20
  Builder receives: $10.00 − $0.20 = $9.80
If an Operator (agent spend manager) is also involved, their fee is charged on top of the builder fee from the same transaction:
Transaction: $10.00 USDC API call
Builder tier: Basic (1%)   Operator tier: Pro (1%)

  Builder fee to platform:   $10.00 × 1% = $0.10
  Operator fee to platform:  $10.00 × 1% = $0.10
  Total platform cut:                       $0.20
  Builder receives:          $10.00 − $0.20 = $9.80
Fee collection
Fees are collected in one of two ways, depending on how the payment is made:
| Method | When | How it works |
|---|---|---|
| Splitter (atomic) | PaymentSplitter contract transactions | Funds are split on-chain automatically in a single transaction — builder and platform each receive their share instantly. |
| x402 (deferred) | Standard x402 payments | The fee is recorded in a ledger. The builder settles accumulated fees later via on-chain payment or admin action. |
Both methods calculate the same fee amount; they differ only in when the platform receives the funds.
Tier comparison
Each tier unlocks progressively more features. Use the tables below to see exactly what's included in each plan. You can also see pricing on the home page.
Pay-as-you-go (fee-based)
Monthly subscription (0% fees)
Prefer predictable costs? Monthly plans give you the same features with zero per-transaction fees:
| Tier | Price | Endpoints | Requests/mo | History |
|---|---|---|---|---|
| Basic | $19/mo | 1 | 10K | 7 days |
| Pro | $49/mo | 10 | 500K | 90 days |
| Business | $99/mo | Unlimited | 5M | 1 year |
| Enterprise | Custom | Unlimited | Unlimited | Unlimited |
Monthly plans include the exact same features as their fee-based equivalents — Basic matches the 1% tier, Pro matches the 2% tier, Business matches the 3% tier.
Builder tiers (facilitators)
If you list APIs on the Analytix402 marketplace and facilitate payments, Builder tiers determine your fee rate and which analytics you get access to:
| Tier | Fee per tx | Max APIs | History | Key features |
|---|---|---|---|---|
| Starter | 1% (100 bps) | 1 | 7 days | Revenue tracking, basic dashboard |
| Growth | 2% (200 bps) | 5 | 90 days | + Full analytics, customer intel, alerts |
| Scale | 3% (300 bps) | Unlimited | 1 year | + Geo intel, forecasting, security, API access |
Operator tiers (agent spend managers)
If you manage AI agents that call paid APIs, Operator tiers give you spend controls and analytics. Operator fees are charged on top of builder fees from the same transaction.
| Tier | Fee per tx | Key features |
|---|---|---|
| Free | 0.5% (50 bps) | Spend tracking, basic dashboard |
| Pro | 1% (100 bps) | + Budget enforcement, efficiency scoring, alerts |
| Scale | 1.5% (150 bps) | + Purchase memory, price advisor, multi-agent |
| Unlimited | 0% ($99/mo flat) | All features, no per-transaction fee |
Payment headers
The SDK automatically reads these x402 headers from incoming requests. You don't need to parse them yourself.
| Header | What it contains |
|---|---|
x-payment | Payment receipt or proof |
x-payment-token | Payment JWT |
x-payer | Payer's wallet address |
x-payment-amount | Payment amount |
x-payment-currency | Currency (e.g., USDC) |
x-payment-tx | On-chain transaction hash |
x-facilitator | Facilitator URL that processed the payment |
Rate limits
The Analytix402 API itself has rate limits to keep things fair:
| Context | Limit |
|---|---|
| SDK event ingestion | 1,000 events/second per API key |
| Dashboard API | 60 requests/minute per user |
| Public scan API (no key) | 5 requests/minute per IP |
| Public scan API (with key) | 60 requests/minute per key |
If you hit a rate limit, the API returns a 429 with Retry-After header. The SDK handles retries automatically with exponential backoff, so you shouldn't need to worry about this in most cases.
Self-hosting
If you'd rather run Analytix402 on your own infrastructure, you can. The backend is a standard Node.js/Express app with a PostgreSQL database (via Supabase).
Cloning into 'Analytix402'...
done.
$ cd Analytix402
$ npm install
added 142 packages in 8.4s
$ cp .env.example .env
# Fill in your Supabase credentials, wallet addresses, etc.
$ npm run dev
Analytix402 server listening on port 3000
You'll need a Supabase project (or any PostgreSQL database), and optionally a Resend account for email alerts. Check .env.example for the full list of environment variables.
For production, there's a Dockerfile included:
Step 1/8 : FROM node:20-alpine AS builder
...
Successfully tagged analytix402:latest
$ docker run -p 3000:3000 --env-file .env analytix402
Analytix402 server listening on port 3000
Once your self-hosted instance is running, point your SDK/MCP/OpenClaw baseUrl to it instead of the default.
Troubleshooting
Here are the most common issues people run into and how to fix them:
No events showing up in the dashboard
First, make sure you added the middleware before your route handlers. If it's registered after, it won't see the requests. Second, try enabling debug: true in your SDK config — this logs every event the SDK captures and every batch it sends. If you see events being sent but nothing in the dashboard, double-check your API key.
API key warning on startup
If you see "ANALYTIX402_API_KEY not set", the key isn't reaching your app. Make sure it's set as an environment variable or passed directly in the config. On most platforms, this means adding it to your .env file or your hosting provider's environment settings.
MCP tools not showing in Claude Desktop
Claude Desktop only reads its config on startup. After editing the config file, you need to fully restart Claude (not just close and reopen a conversation). Also verify the JSON is valid — a trailing comma or missing bracket will silently fail.
Node version errors
The SDK needs Node 18 or higher. The OpenClaw skill needs Node 22+. Check your version with node --version and upgrade if needed.
Connection timeouts
If the SDK can't reach our servers, events queue locally. Make sure your server can make outbound HTTPS requests to analytix402.com. Some corporate firewalls or container configurations block outbound traffic by default.
Something else?
Drop us a line at team@analytix402.com or open an issue on GitHub. We usually respond within a day.